Answers to 5 of the most common questions.
 Photo: Bethany Legg (Unsplash, CC)
Climate change is all over the news. However, the news cannot always convey answers to some frequent questions. These questions, which often come back in one form or another, are:
1. How can we talk about climate in 100 years if we do not know if it will rain in 20 days?
2. How do we know that there is a climate change?
3. How do we know it comes from the increase in greenhouse gases (GHG)?
4. How do we know that these GHGs come from human activity?
5. Do the experts agree?
I will try to answer them here as briefly as possible1.
1. HOW CAN WE TALK ABOUT CLIMATE IN 100 YEARS...?
It is a very pertinent question indeed, which will allow us to understand the difference between climate, and time. To answer it, let's ask two more questions:
a. Will it be warmer in Madrid in July 2030 than in January 2030?
b. Will it rain in Madrid on 20 June 2020?
I think anyone would answer "yes" to question (a), and "no idea" to question (b). How can we achieve certainty in question (a) while it is impossible with the other?
When we think of (a) we think about what should happen in July and January. And what should happen is related to the height of the Sun in the sky. The higher, the more heat comes the longer, and the more heat it makes. But when we think about question (b) we think about what will actually happen on that day, and here we find it impossible to answer more than a week or two in advance.
Question (a) has to do with the weather; (b) over time. As the English climatologist Mike Hulme wrote, "Climate is what you expect, time is what you have" 2. It is possible to predict the weather. For this reason, tourist guides can inform about the average temperature in Madrid throughout the year, without the need for a crystal ball.
But predicting time well in advance is impossible. For this reason, unfortunate tourists may have rain when visiting Madrid in June, despite their tour guide who told them that it rained very little in Madrid in June.
2. HOW DO WE KNOW THERE IS A CLIMATE CHANGE?
The most mediated indicator is the global temperature curve. It is an average of the temperatures along the surface of the planet. The global temperature has been rising for about a century, beating records regularly. We have gained around 1°C for a century (this figure of 1°C will play an important role in answering the next question). However, it should be noted that it is not the only indicator. Let's look at six more, which all point to a warm-up.
Let's start with downward indicators:
1. The extent of Arctic ice is reduced.
2. The volume of Greenland ice is reduced.
3. The volume of Antarctica is reduced.
4. The volume of terrestrial glaciers is reduced.
Let's now continue with Indicators on the rise,
5. The heat contained in the oceans rises.
6. The global temperature rises, as we have already seen.
7. The sea level rises.
We then came to a total of seven indicators, all pointing in the same direction: a warming of the planet. Even before we know their origin, these seven observations lead us to the conclusion that global warming is occurring. Let's see why.
3. HOW DO WE KNOW IT COMES FROM THE INCREASE IN GREENHOUSE GASES (GHG)?
The planet is getting warmer. Why? What does the climate of the planet depend on? It depends on the amount of solar energy that comes from the Sun, and the composition of the atmosphere. Similarly, the temperature in my bed depends on the temperature in my room (the "Sun"), and the blankets I carry (the "atmosphere"). Let's start with the Sun. Obviously, it is the first suspect. Does the Sun have cycles that could change the weather? Yes. In fact, the last glacial ages were the fruit of the so-called Milankovitch cycles. They do not exactly result from changes of the Sun itself, but from changes in the Earth's orbit. But if they could provoke glacial ages, they cannot be responsible for the current change. Why? It is because the shortest of these cycles is about 20,000 years; too slow to explain "our" warming which has been going on for a century or two. So if the Milankovitch cycles are too long, are there natural cycles shorter? Yes. The Sun itself has a cycle of 11 years. But it cannot be responsible for the current change. On the one hand, it is too short and lacks consistency. Goes up, down; up, down ... over a period of 11 years while looking for a responsible for a gradual warming happening over a century. In addition, a very simple calculation allows concluding that this cycle alone could provoke variations of global temperature of 0, 1°C 3. The problem is that we observe 10 times more (see previous paragraph); too short, too weak, absence of definite direction. Nor is the cycle of 11 years. Total, it is not the Sun.
Then it must be the atmosphere. No choice. It acts like a blanket whose thickness depends on its composition. The most effective gases in this respect, the famous "greenhouse gases" (GHG) are, in order of importance, water vapor (H2O), carbon dioxide (CO2), and methane (CH4)4. Without them, the average temperature of the planet would be -15°C.
What about water vapor? It has something special. The amount of water vapor in the atmosphere depends only on the temperature of the atmosphere. What happens if there is too much? The excess water falls again. We call it "rain". The warmer, the more water holds in the atmosphere. This has a very interesting consequence: water vapor alone cannot be the cause of warming up. If there is more up there (and there is), such an increase can only be the result of heating; does not cause it. Something else must have warmed the atmosphere.
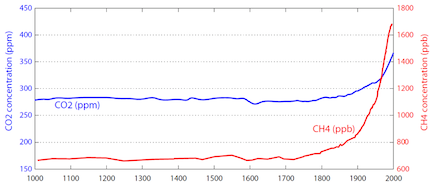
What can that "something else" be? Only two suspects remain: carbon dioxide, or methane. It has to be one of the two, or both at the same time. Let's check it out. We can begin by graphically depicting the evolution of the concentration of these gases in the atmosphere for 1000 years:

As it can be seen, these concentrations begin to rise at the beginning of the nineteenth century, with acceleration in the century XX. Today, the CO2 concentration has reached 400 parts per million (ppm)5 representing an increase of 42% over the pre-industrial era. As for methane, it has more than doubled. We already have our heating factor, and with the correct time scale. Our atmospheric blanket has been thickening for a century or two, in line with the warming indicators previously observed. Let's keep checking: what is the increase in temperature that could be expected from such increases in these gases? A calculation, even simple, gives us 1°C, that is, the observed6.
Summary: Once the sun and water vapor, i.e. the suspects that could be causing the change, are eliminated, we only have carbon dioxide and methane left. They have to be them. We checked, and found exactly what we expected. Its increase coincides with the heating, and the calculation ends. The blame for the warming is the recent rise in CO2 and CH4 in the atmosphere.
4. HOW DO WE KNOW THAT THESE GHGs COME FROM HUMAN ACTIVITY?
This is also a good question. Where does this rise in CO2 and CH4 come from? Does it come from the volcanoes? They are often considered suspects. But we can excuse them for at least four reasons:
- We have recorded CO2 and CH4 for almost a million years7 and never reached current levels. If the volcanoes started to do something now that they did not in a million years, you would know.
- As shown in the figure above, CO2 and CH4 are rising steadily. The volcanoes would have to be very well synchronized to cause such gradual increase.
- Volcanoes emit about 0.6 Giga-tons (Gt) of CO2 per year8. The man emits 30 Gt, 50 times more than the volcanoes.
- Volcanoes emit CO2, which heats, and also ashes, which cool. Observations show that they gain the ashes. So the overall effect of a volcanic eruption is a cooling, not a warming. So where will these GHGs come from? The figure above gives us a clue: its increase began with the industrial revolution, which consisted in burning coal.
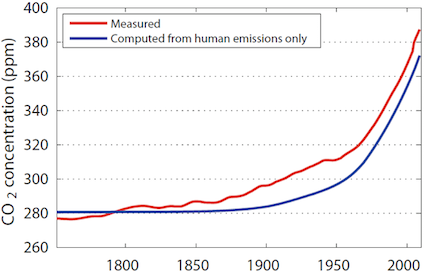
Will these GHGs come from human activity? To verify this hypothesis, we can consider, year after year, the amount of GHG discharged by man into the atmosphere, and reconstitute the evolution of the atmospheric concentration in CO2 and CH4, relying solely on human activity.
The figure below is the result of this calculation for CO2.
I computed the blue curve beginning with the concentrations known in 1800, and adding each year what was emitted9. The red curve comes from observations. Both fit extraordinarily. The difference between red and blue comes from deforestation.

There is no doubt. The rise of GHGs in the atmosphere has its origin in the massive use of fossil fuels. This can be checked in other ways,10 and all the evidence is conclusive. These GHGs are "ours".
5. DO THE EXPERTS AGREE?
There is a climate change. And it is due to human activity. What do those who contribute to the progress of knowledge in this area say? What do the experts say on the subject? They agree. Several surveys have been conducted in recent years. They concluded that more than 97% of experts agree.
I attended the "Fall Conference of the American Union of Geophysics" at the end of 2015 (2015 AGU Fall Meeting). With more than 20,000 participants, this conference, held annually, is the largest in the world. There, among others, climate experts gather to present their research.
How many interventions questioned the existence of a climate change? Zero. Everyone agreed with the remarks. There is a change.
How many interventions questioned the role of human activity as the engine of change? Zero.
Such questions were a matter of research 20 years ago11. No longer now. There is global warming, and it is of human origin. Instead, there were many interventions on how to convey this knowledge to the public. It should be noted to conclude that what is happening is not a surprise at all. Almost two centuries ago, in 1824, the French Joseph Fourier already had clear the principle of the greenhouse effect by means of which the atmosphere heats the planet. In 1896, the Swedish Arrhenius calculated, by hand, of course, the increase in temperature that would cause a doubling of CO2 in the atmosphere. Applying its formula to the recent increase of 40% of the same CO2, one finds a warming of + 3oC. Not bad for someone who ignored the details of the interaction between the molecules of the atmosphere and the radiation that the earth sends to space12.
The current warming is not a surprise to the scientific community. I was expecting it. I hope I have contributed to a better understanding of why.
Antoine Bret is a professor at the University of Castilla-La Mancha (Spain) and PhD in Physics from the University of Orsay (France).
Notes
1. Antoine Bret is a PhD in Physics and Professor at the Castilla-La Mancha University where he teaches a course on energy and climate since 2004. He has also given a series of 6 seminars on the subject at Instituto de Empresa. He has published his course in The Energy-Climate Continuum: Lessons from Basic Science and History (Springer, 2014). This text corresponds to a conference given by the author during the conference organized by A'Rocha França during the COP 21 in Paris, entitled "A Christian Response to Climate Change" (2015).
2. "Climate is what you expect, weather is what you get". M. Hulme, ‘Why We Disagree About Climate Change’ (Cambridge University Press, Cambridge, 2009), p. 1.
3. See A. Bret, ‘The Energy-Climate Continuum’ (Springer, 2014), p. 47.
4. There are more, but these 3 are the most important.
5. The concentration of methane is given in "ppb", part by "billion", where English billion is worth billions.
6. The calculation can be done using equation (4.9) of my book, and the reference given below, which allows to evaluate the variation of parameter e under a CO2 increase of 40%. Myhre et al., New estimates of radioactive forcing due to well-mixed greenhouse gases, Geophysical Research Letters, Vol 25, No. 14, p 2715-2718, 1998.
7. J. Jouzel, et al: ‘Orbital and millennial Antarctic climate variability over the past 800,000 years’. Science, 317: 793, 2007. L. Loulergue, et al. Orbital and millennial-scale features of atmospheric CH4 over the past 800,000 years. Nature, 453: 383, 2008. D. Lüthi, et al. High-resolution carbon dioxide concentration record 650,000-800,000 years before present. Nature, 453: 379, 2008.
8. 1 Giga = billion. For the 0.6 Gt figure, see Burton et al., Deep Carbon Emissions from Volcanoes, Reviews in Mineralogy & Geochemistry Vol. 75 pp. 323-354, 2013.
9. But forget half going in the ocean.
10. An example: if the excess CO2 comes from combustion, then the amount of oxygen in the atmosphere should go down. The observations confirm this perfectly (design an examination based on this topic in 2011). More conclusive evidence, however, can be made with atmospheric concentrations in Carbon 13 or 14.
11. See the history of this consensus in S. Sherwood ‘Science Controversies, Past and Present, Physics Today’, October 2011, p. 39.
12. The quantum mechanics was lacking.

Las opiniones vertidas por nuestros colaboradores se realizan a nivel personal, pudiendo coincidir o no con la postura de la dirección de Protestante Digital.
Si quieres comentar o